Using the Chart Control on sheet
You can add a chart control to the sheet using code, Spread designer, and Visual Studio Design view. You can also allow the user to resize the chart and the range of data used in the chart control. For more details on adding chart control using Spread designer, refer to Adding a Chart Control.
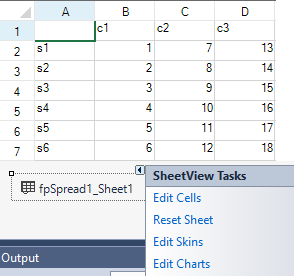
- Click on the fpSpread1_Sheet1 object at the bottom of the page.
- Click on the arrow at the top right of the object and select Edit Charts.
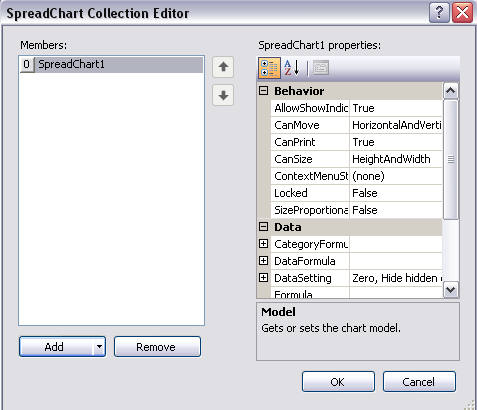
- This brings up the SpreadChart Collection Editor. Click Add to add a chart and then set the chart properties.
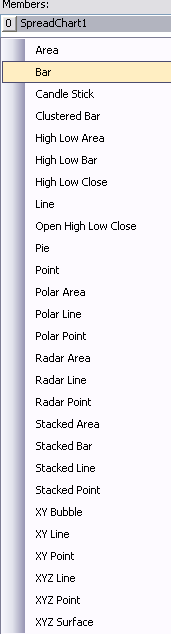
- The Add button has a drop-down menu with chart type options (bar, for example).
- Select Model in the SpreadChart Collection Editor to bring up the chart designer or choose the PlotAreas Collection under Model. Use the Add button drop-down menu to select a plot area type (YPlotArea, for example).
- Use the Series Collection to add a series type (BarSeries, for example). The Add button has a drop-down for the types of series you can add.
- Use the Values Collection to bring up the Double Collection Editor that can be used to add data to the chart.
- Select OK for each dialog.
You can add a chart control to the Spread control using code. This example creates data in cells and then adds the chart control.
Example
| C# |
Copy Code
|
fpSpread1.Sheets[0].Cells[0, 1].Value = "c1";
fpSpread1.Sheets[0].Cells[0, 2].Value = "c2";
fpSpread1.Sheets[0].Cells[0, 3].Value = "c3";
fpSpread1.Sheets[0].Cells[1, 0].Value = "s1";
fpSpread1.Sheets[0].Cells[2, 0].Value = "s2";
fpSpread1.Sheets[0].Cells[3, 0].Value = "s3";
fpSpread1.Sheets[0].Cells[4, 0].Value = "s4";
fpSpread1.Sheets[0].Cells[5, 0].Value = "s5";
fpSpread1.Sheets[0].Cells[6, 0].Value = "s6";
fpSpread1.Sheets[0].Cells[1, 1].Value = 1;
fpSpread1.Sheets[0].Cells[2, 1].Value = 2;
fpSpread1.Sheets[0].Cells[3, 1].Value = 3;
fpSpread1.Sheets[0].Cells[4, 1].Value = 4;
fpSpread1.Sheets[0].Cells[5, 1].Value = 5;
fpSpread1.Sheets[0].Cells[6, 1].Value = 6;
fpSpread1.Sheets[0].Cells[1, 2].Value = 7;
fpSpread1.Sheets[0].Cells[2, 2].Value = 8;
fpSpread1.Sheets[0].Cells[3, 2].Value = 9;
fpSpread1.Sheets[0].Cells[4, 2].Value = 10;
fpSpread1.Sheets[0].Cells[5, 2].Value = 11;
fpSpread1.Sheets[0].Cells[6, 2].Value = 12;
fpSpread1.Sheets[0].Cells[1, 3].Value = 13;
fpSpread1.Sheets[0].Cells[2, 3].Value = 14;
fpSpread1.Sheets[0].Cells[3, 3].Value = 15;
fpSpread1.Sheets[0].Cells[4, 3].Value = 16;
fpSpread1.Sheets[0].Cells[5, 3].Value = 17;
fpSpread1.Sheets[0].Cells[6, 3].Value = 18;
FarPoint.Win.Spread.Model.CellRange range = new FarPoint.Win.Spread.Model.CellRange(0, 0, 7, 4);
fpSpread1.Sheets[0].AddChart(range, typeof(FarPoint.Win.Chart.BarSeries), 400, 300, 0, 0, FarPoint.Win.Chart.ChartViewType.View3D, false);
|
| Visual Basic |
Copy Code
|
FpSpread1.Sheets(0).Cells(0, 1).Value = "c1"
FpSpread1.Sheets(0).Cells(0, 2).Value = "c2"
FpSpread1.Sheets(0).Cells(0, 3).Value = "c3"
FpSpread1.Sheets(0).Cells(1, 0).Value = "s1"
FpSpread1.Sheets(0).Cells(2, 0).Value = "s2"
FpSpread1.Sheets(0).Cells(3, 0).Value = "s3"
FpSpread1.Sheets(0).Cells(4, 0).Value = "s4"
FpSpread1.Sheets(0).Cells(5, 0).Value = "s5"
FpSpread1.Sheets(0).Cells(6, 0).Value = "s6"
FpSpread1.Sheets(0).Cells(1, 1).Value = 1
FpSpread1.Sheets(0).Cells(2, 1).Value = 2
FpSpread1.Sheets(0).Cells(3, 1).Value = 3
FpSpread1.Sheets(0).Cells(4, 1).Value = 4
FpSpread1.Sheets(0).Cells(5, 1).Value = 5
FpSpread1.Sheets(0).Cells(6, 1).Value = 6
FpSpread1.Sheets(0).Cells(1, 2).Value = 7
FpSpread1.Sheets(0).Cells(2, 2).Value = 8
FpSpread1.Sheets(0).Cells(3, 2).Value = 9
FpSpread1.Sheets(0).Cells(4, 2).Value = 10
FpSpread1.Sheets(0).Cells(5, 2).Value = 11
FpSpread1.Sheets(0).Cells(6, 2).Value = 12
FpSpread1.Sheets(0).Cells(1, 3).Value = 13
FpSpread1.Sheets(0).Cells(2, 3).Value = 14
FpSpread1.Sheets(0).Cells(3, 3).Value = 15
FpSpread1.Sheets(0).Cells(4, 3).Value = 16
FpSpread1.Sheets(0).Cells(5, 3).Value = 17
FpSpread1.Sheets(0).Cells(6, 3).Value = 18
Dim range As New FarPoint.Win.Spread.Model.CellRange(0, 0, 7, 4)
FpSpread1.Sheets(0).AddChart(range, GetType(FarPoint.Win.Chart.BarSeries), 400, 300, 0, 0, FarPoint.Win.Chart.ChartViewType.View3D, False)
|
You can add a chart control to the Spread control using code. This example creates a chart control, adds data to the chart control, and then adds the chart control to Spread.
| C# |
Copy Code
|
FarPoint.Win.Chart.BarSeries series = new FarPoint.Win.Chart.BarSeries();
series.Add(2.0);
series.Add(4.0);
series.Add(3.0);
series.Add(5.0);
FarPoint.Win.Chart.YPlotArea plotArea = new FarPoint.Win.Chart.YPlotArea();
plotArea.Location = new PointF(0.2f, 0.2f);
plotArea.Size = new SizeF(0.6f, 0.6f);
plotArea.Series.Add(series);
FarPoint.Win.Chart.LabelArea label = new FarPoint.Win.Chart.LabelArea();
label.Text = "Bar Chart";
label.Location = new PointF(0.5f, 0.02f);
label.AlignmentX = 0.5f;
label.AlignmentY = 0.0f;
FarPoint.Win.Chart.LegendArea legend = new FarPoint.Win.Chart.LegendArea();
legend.Location = new PointF(0.98f, 0.5f);
legend.AlignmentX = 1.0f;
legend.AlignmentY = 0.5f;
FarPoint.Win.Chart.ChartModel model = new FarPoint.Win.Chart.ChartModel();
model.LabelAreas.Add(label);
model.LegendAreas.Add(legend);
model.PlotAreas.Add(plotArea);
FarPoint.Win.Spread.Chart.SpreadChart chart = new FarPoint.Win.Spread.Chart.SpreadChart();
chart.Size = new Size(200, 200);
chart.Location = new Point(100, 100);
chart.Model = model;
fpSpread1.Sheets[0].Charts.Add(chart);
|
| Visual Basic |
Copy Code
|
Dim series As New FarPoint.Win.Chart.BarSeries()
series.Add(2.0)
series.Add(4.0)
series.Add(3.0)
series.Add(5.0)
Dim plotArea As New FarPoint.Win.Chart.YPlotArea()
plotArea.Location = New PointF(0.2F, 0.2F)
plotArea.Size = New SizeF(0.6F, 0.6F)
plotArea.Series.Add(series)
Dim label As New FarPoint.Win.Chart.LabelArea()
label.Text = "Bar Chart"
label.Location = New PointF(0.5F, 0.02F)
label.AlignmentX = 0.5F
label.AlignmentY = 0.0F
Dim legend As New FarPoint.Win.Chart.LegendArea()
legend.Location = New PointF(0.98F, 0.5F)
legend.AlignmentX = 1.0F
legend.AlignmentY = 0.5F
Dim model As New FarPoint.Win.Chart.ChartModel()
model.LabelAreas.Add(label)
model.LegendAreas.Add(legend)
model.PlotAreas.Add(plotArea)
Dim chart As New FarPoint.Win.Spread.Chart.SpreadChart()
chart.Size = New Size(200, 200)
chart.Location = New Point(100, 100)
chart.Model = model
FpSpread1.Sheets(0).Charts.Add(chart)
|