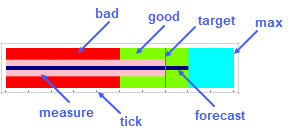
A bullet sparkline is a variation of a bar graph where it can show a lot of data in a small amount of space. It is typically used when displaying performance data.
The bullet sparkline formula has the following syntax:
=BULLETSPARKLINE(measure, target, max, [good, bad, forecast, tickunit, colorScheme, vertical, measureColor, targetColor, maxiColor, goodColor, badColor, forecastColor, allowMeasureOverMaxi, barSize])
The formula options are described below:
| Option | Description |
| measure | A number or reference that represents the length of the measure bar, such as 5 or "A1". |
| target | A number or reference that represents the location of the target line, such as 7 or "A2". |
| max | A number or reference that represents the maximum value of the sparkline, such as 10 or "A3". |
|
good Optional |
A number or reference that represents the length of the good bar, such as 3 or "A4". The default value is 0. |
|
bad Optional |
A number or reference that represents the length of the bad bar, such as 1 or "A5". The default value is 0. |
|
forecast Optional |
A number or reference that represents the length of the forecast line, such as 8 or "A6". The default value is 0. |
|
tickunit Optional |
A number or reference that represents the tick unit, such as 1 or "A7". The default value is 0. |
|
colorScheme Optional |
A string that represents a color scheme for displaying the sparkline. The default value is "#A0A0A0". |
|
vertical Optional |
A boolean value that indicates whether to display or not the sparkline vertically. The default value is false. |
|
measureColor Optional |
A color string that indicates the color of measure bar. |
|
targetColor Optional |
A color string that indicates the color of target line. |
|
maxiColor Optional |
A color string that indicates the color of the maxi area. |
|
goodColor Optional |
A color string that indicates the color of the good area. |
|
badColor Optional |
A color string that indicates the color of the bad area. |
|
forecastColor Optional |
A color string that indicates the color of the forecast line. |
|
allowMeasureOverMaxi Optional |
A Boolean value that indicates whether the measure can exceed maxi area. The default value of this parameter is false. |
|
barSize Optional |
A number value greater than 0 and equal to or less than 1, which indicates the percentage of bar width or height according to the cell width or height. |
Usage Scenario
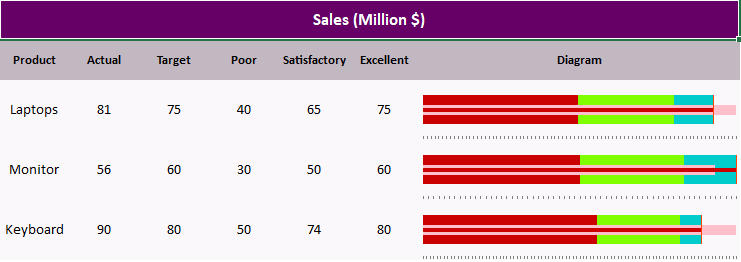
Consider a scenario where an electronic store wants to analyze the performance of its product sales through its defined measures. A bullet sparkline can showcase all the required factors, effectively shown in the image below.
| C# |
Copy Code
|
|---|---|
// Set data worksheet.SetValue(1, 0, new object[,] { {"Product","Actual","Target","Poor","Satisfactory","Excellent", "Diagram" }, {"Laptops",81,75,40,65,75, null}, {"Monitor", 56,60,30,50,60, null}, {"Keyboard",90,80,50,74,80, null} }); // Set BulletSparkline formula worksheet.Cells[2, 6, 4, 6].Formula = "BULLETSPARKLINE(B3, C3, F3, E3, D3, 100, 1, \"#FFFFFF\", FALSE, \"#FFC0CB\", \"#FF4500\", \"#00cccc\", \"#7FFF00\", \"00cccc\", \"#000080\", TRUE, 0.5)"; |
|
| Visual Basic |
Copy Code
|
|---|---|
'Set data worksheet.SetValue(1, 0, New Object(,) { {"Product", "Actual", "Target", "Poor", "Satisfactory", "Excellent", "Diagram"}, {"Laptops", 81, 75, 40, 65, 75, Nothing}, {"Monitor", 56, 60, 30, 50, 60, Nothing}, {"Keyboard", 90, 80, 50, 74, 80, Nothing} }) 'Set BulletSparkline formula worksheet.Cells(2, 6, 4, 6).Formula = "BULLETSPARKLINE(B3, C3, F3, E3, D3, 100, 1, ""#FFFFFF"", FALSE, ""#FFC0CB"", ""#FF4500"", ""#00cccc"", ""#7FFF00"", ""00cccc\"", ""#000080"", TRUE, 0.5)" |
|
Using the Spread Designer
- Type data in a cell or a column or row of cells in the designer.
- Select a cell for the sparkline.
- Select the Insert menu.
- Select a sparkline type.
- Set the Data Range in the Create Sparklines dialog (such as =Sheet1!$E$1:$E$3).
Alternatively, set the range by selecting the cells in the range using the pointer.
You can also set additional sparkline settings in the dialog if available.
- Select OK.
- Select Apply and Exit from the File menu to save your changes and close the designer.