Creating a Y Plot
In This Topic
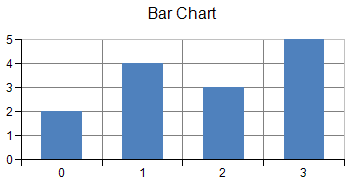
You can create a Y Plot chart using code or the designer. The following image shows a Y Plot bar type chart.
For details on the API, see the YPlotArea class.
The following classes are also available when creating Y plot type charts:
- Area chart
AreaSeries - Bar chart
BarSeries - Box Whisker
BoxWhiskerSeries - Funnel chart
FunnelSeries - Histogram chart
HistogramSeries - Line chart
LineSeries - Market Data (High-Low) chart
CandlestickSeries, HighLowAreaSeries, HighLowBarSeries, HighLowCloseSeries, OpenHighLowCloseSeries - Pareto chart
ParetoSeries - Point chart
PointSeries - Waterfall chart
WaterfallSeries
Also, you can add aggregate data series (Clustered Bar Chart, Stacked Bar Chart) with multiple series. The following classes refer the series collection from Series property respectively.
- Clustered bar Chart
ClusteredBarSeries - Stacked bar chart
StackedBarSeries - Stacked area chart
StackedAreaSeries - Stcaked line chart
StackedLineSeries - Stacked point chart (Scatter chart)
StackedPointSeries
Using Code
- Create a BarSeries object that represents the data series of bar chart and add the data.
- Create a YPlotArea object that represents the plot area and set its position and size.
- Add a data series to the plot area.
- Create label and legend area.
- Create a ChartModel object and add plot area, label and legend area.
- Assign a chart model to the chart.
Example
The following example creates a bar chart.
| C# |
Copy Code
|
|---|---|
FarPoint.Win.Chart.BarSeries series = new FarPoint.Win.Chart.BarSeries(); series.SeriesName = "Series 0"; series.Values.Add(2.0); series.Values.Add(4.0); series.Values.Add(3.0); series.Values.Add(5.0); FarPoint.Win.Chart.YPlotArea plotArea = new FarPoint.Win.Chart.YPlotArea(); plotArea.Location = new PointF(0.2f, 0.2f); plotArea.Size = new SizeF(0.6f, 0.6f); plotArea.Series.Add(series); FarPoint.Win.Chart.LabelArea label = new FarPoint.Win.Chart.LabelArea(); label.Text = "Bar Chart"; label.Location = new PointF(0.5f, 0.02f); label.AlignmentX = 0.5f; label.AlignmentY = 0.0f; FarPoint.Win.Chart.LegendArea legend = new FarPoint.Win.Chart.LegendArea(); legend.Location = new PointF(0.98f, 0.5f); legend.AlignmentX = 1.0f; legend.AlignmentY = 0.5f; FarPoint.Win.Chart.ChartModel model = new FarPoint.Win.Chart.ChartModel(); model.LabelAreas.Add(label); model.LegendAreas.Add(legend); model.PlotAreas.Add(plotArea); chart2DControl1.Model = model; |
|
| Visual Basic |
Copy Code
|
|---|---|
Dim series As New FarPoint.Win.Chart.BarSeries() series.SeriesName = "Series 0" series.Values.Add(2.0) series.Values.Add(4.0) series.Values.Add(3.0) series.Values.Add(5.0) Dim plotArea As New FarPoint.Win.Chart.YPlotArea() plotArea.Location = New PointF(0.2F, 0.2F) plotArea.Size = New SizeF(0.6F, 0.6F) plotArea.Series.Add(series) Dim label As New FarPoint.Win.Chart.LabelArea() label.Text = "Bar Chart" label.Location = New PointF(0.5F, 0.02F) label.AlignmentX = 0.5F label.AlignmentY = 0.0F Dim legend As New FarPoint.Win.Chart.LegendArea() legend.Location = New PointF(0.98F, 0.5F) legend.AlignmentX = 1.0F legend.AlignmentY = 0.5F Dim model As New FarPoint.Win.Chart.ChartModel() model.LabelAreas.Add(label) model.LegendAreas.Add(legend) model.PlotAreas.Add(plotArea) chart2DControl1.Model = model |
|
Using Chart designer
- Run the Chart Designer.
- Select the target Chart Model from the tree menu on the left.
- Open the Plot Area Collection Editor from Prot Areas in the Other section of the property list on the right.
- Click the drop-down button to the right of the Add button.
- Select and add YPlotArea and set each property as needed.
For more information regarding opening the [Chart Designer], kindly refer to "Using the Chart Designer" in the "Spread Designer Guide".