Hbar and vbar sparklines present categorical data with rectangular bars with heights or lengths proportional to the values that they represent. These sparklines can be used to show variations or ranges in the given data.

The sparkline starts at the left or bottom of the cell for positive values and the top or right of the cell for negative values. If the value is greater than 100% or smaller than -100%, an arrow is displayed.
The hbar and vbar sparkline formulas have the following syntax:
=HBARSPARKLINE(value, [colorScheme, axisVisible, barHeight, minimum, maximum, axisValue])
=VBARSPARKLINE(value, [colorScheme, axisVisible, barWidth, minimum, maximum, axisValue])
The formula options are described below:
| Option | Description |
| value | A number or reference that represents the length of the bar. The value should be between -1 and 1. |
|
colorScheme Optional |
A string that represents the color of the bar. The default value is "grey". |
|
axisVisible Optional |
A Boolean value that indicates whether or not to show the axis. The default value is true. |
|
barHeight (Hbar) or barWidth (Vbar) Optional |
A number greater than 0 and less than or equal to 1, which indicates the percentage of bar height or bar width according to the cell height or cell width. Default value is 0.7 |
|
minimum Optional |
A number that represents the minimum axis value. The default value is 0 if the value is greater than 0, or -1 if the value is less than 0. |
|
maximum Optional |
A number that represents the maximum axis value. The default value is 1 if the value is greater than 0, or 0 if the value is less than 0. |
|
axisValue Optional |
A number that represents the axis intercept value (where the axis line is drawn). The value should be between minimum and maximum values. If the value is out of range, it will be adjusted to the minimum or maximum value. The default value is 0. |
Usage Scenario
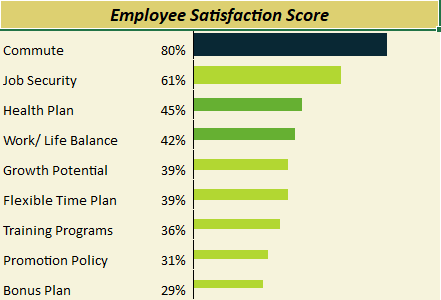
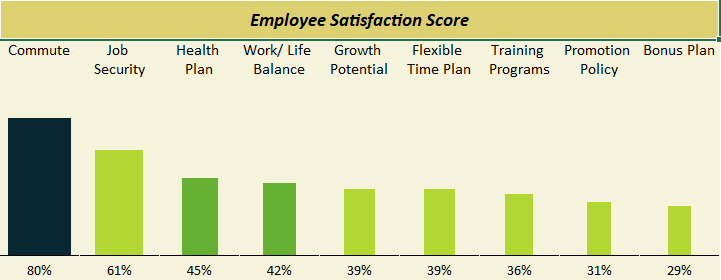
Consider a scenario where a company wants to display the employee satisfaction scores against different aspects of work. The hbar and vbar sparklines can show variations between each category provided during the company survey.
Hbar Sparkline
Vbar Sparkline
| C# |
Copy Code
|
|---|---|
// Set data for HBarSprkline worksheet1.SetValue(1, 0, new object[,] { {"Commute",0.8, null}, {"Job Security",0.61, null}, {"Health Plan",0.45, null}, {"Work/ Life Balance",0.42, null}, {"Growth Potential",0.39, null}, {"Flexible Time Plan",0.39, null}, {"Training Programs",0.36, null}, {"Promotion Policy",0.31, null}, {"Bonus Plan",0.29, null} }); // Set number format worksheet1.Cells["B2:B10"].NumberFormat = "0%"; // Set HBarSparkline formula worksheet1.Cells["C2:C13"].Formula = "IF(B2>=0.8,HBARSPARKLINE(B2,\"#092834\",TRUE,B2),IF(B2>=0.6,HBARSPARKLINE(B2,\"#B2D732\",TRUE,B2),IF(B2>=0.4,HBARSPARKLINE(B2,\"#66B032\",TRUE,B2),IF(B2>=0.2,HBARSPARKLINE(B2,\"#B2D732\",TRUE,B2),IF(B2>=0,HBARSPARKLINE(B2,\"#8e1963\",TRUE,B2),HBARSPARKLINE(B2,\"red\"))))))"; // Set data for VBarSprkline worksheet2.SetValue(1, 0, new object[,] { {"Commute","Job Security","Health Plan","Work/ Life Balance","Growth Potential","Flexible Time Plan","Training Programs","Promotion Policy","Bonus Plan" }, }); worksheet2.SetValue(3, 0, new object[,] { {0.80, 0.61, 0.45, 0.42,0.39, 0.39, 0.36, 0.31, 0.29} }); // Set VBarSparkline formula worksheet2.Cells["A3:I3"].Formula = "IF(A4>=0.8,VBARSPARKLINE(A4,\"#092834\",TRUE,A4),IF(A4>=0.6,VBARSPARKLINE(A4,\"#B2D732\",TRUE,A4),IF(A4>=0.4,VBARSPARKLINE(A4,\"#66B032\",TRUE,A4),IF(A4>=0.2,VBARSPARKLINE(A4,\"#B2D732\",TRUE,A4),IF(A4>=0,VBARSPARKLINE(A4,\"#8e1963\",TRUE,A4),VBARSPARKLINE(A4,\"red\"))))))"; |
|
| Visual Basic |
Copy Code
|
|---|---|
'Set data for HBarSprkline worksheet1.SetValue(1, 0, New Object(,) { {"Commute", 0.8, Nothing}, {"Job Security", 0.61, Nothing}, {"Health Plan", 0.45, Nothing}, {"Work/ Life Balance", 0.42, Nothing}, {"Growth Potential", 0.39, Nothing}, {"Flexible Time Plan", 0.39, Nothing}, {"Training Programs", 0.36, Nothing}, {"Promotion Policy", 0.31, Nothing}, {"Bonus Plan", 0.29, Nothing} }) 'Set number format worksheet1.Cells("B2:B10").NumberFormat = "0%" 'Set HBarSparkline formula worksheet1.Cells("C2:C13").Formula = "IF(B2>=0.8,HBARSPARKLINE(B2,""#092834"",TRUE,B2),IF(B2>=0.6,HBARSPARKLINE(B2,""#B2D732"",TRUE,B2),IF(B2>=0.4,HBARSPARKLINE(B2,""#66B032"",TRUE,B2),IF(B2>=0.2,HBARSPARKLINE(B2,""#B2D732"",TRUE,B2),IF(B2>=0,HBARSPARKLINE(B2,""#8E1963"",TRUE,B2),HBARSPARKLINE(B2,""red""))))))" 'Set data for VBarSparkline worksheet2.SetValue(1, 0, New Object(,) { {"Commute", "Job Security", "Health Plan", "Work/ Life Balance", "Growth Potential", "Flexible Time Plan", "Training Programs", "Promotion Policy", "Bonus Plan"} }) worksheet2.SetValue(3, 0, New Object(,) { {0.8, 0.61, 0.45, 0.42, 0.39, 0.39, 0.36, 0.31, 0.29} }) 'Set VBarSparkline formula worksheet2.Cells("A3:I3").Formula = "IF(A4>=0.8,VBARSPARKLINE(A4,""#092834"",TRUE,A4),IF(A4>=0.6,VBARSPARKLINE(A4,""#B2D732"",TRUE,A4),IF(A4>=0.4,VBARSPARKLINE(A4,""#66B032"",TRUE,A4),IF(A4>=0.2,VBARSPARKLINE(A4,""#B2D732"",TRUE,A4),IF(A4>=0,VBARSPARKLINE(A4,""#8E1963"",TRUE,A4),VBARSPARKLINE(A4,""red""))))))" |
|
Using the Spread Designer
- Type data in a cell or a column or row of cells in the designer.
- Select a cell for the sparkline.
- Select the Insert menu.
- Select a sparkline type.
- Set the Data Range in the Create Sparklines dialog (such as =Sheet1!$E$1:$E$3).
Alternatively, set the range by selecting the cells in the range using the pointer.

You can also set additional sparkline settings in the dialog if available.
- Select OK.
- Select Apply and Exit from the File menu to save your changes and close the designer.