Chart Line Style
You can create a line style with special options such as open and end arrows for the line chart with the LineBorder property and the EnhancedSolidLine class. You can also specify line style options such as dash, cap type, and so on.
Using Code
- Create a line chart.
- Create an EnhancedSolidLine object.
- Set the LineBorder property.
Example
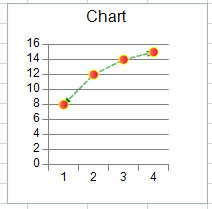
This example code creates a line chart with a line style that contains arrows.
| C# |
Copy Code
|
|---|---|
FarPoint.Win.Chart.EnhancedSolidLine eh = new FarPoint.Win.Chart.EnhancedSolidLine(System.Drawing.Color.Green, 1, FarPoint.Win.Chart.CompoundType.Double, FarPoint.Win.Chart.DashType.Dash, FarPoint.Win.Chart.CapType.Flat, FarPoint.Win.Chart.JoinType.Round, FarPoint.Win.Chart.ArrowType.Arrow, FarPoint.Win.Chart.ArrowType.OpenArrow, 1, 2); FarPoint.Win.Chart.LineSeries series1 = new FarPoint.Win.Chart.LineSeries(); series1.PointMarker = new FarPoint.Win.Chart.BuiltinMarker(FarPoint.Win.Chart.MarkerShape.Circle, 7.0f); series1.PointFill = new FarPoint.Win.Chart.GradientFill(System.Drawing.Color.Coral, System.Drawing.Color.Crimson); series1.PointBorder = new FarPoint.Win.Chart.SolidLine(System.Drawing.Color.Yellow); series1.LineBorder = eh; series1.Values.Add(8.0); series1.Values.Add(12.0); series1.Values.Add(14.0); series1.Values.Add(15.0); FarPoint.Win.Chart.YPlotArea plotArea = new FarPoint.Win.Chart.YPlotArea(); plotArea.Location = new System.Drawing.PointF(0.2f, 0.2f); plotArea.Size = new System.Drawing.SizeF(0.6f, 0.6f); plotArea.Series.Add(series1); FarPoint.Win.Chart.LabelArea labelArea = new FarPoint.Win.Chart.LabelArea(); labelArea.Location = new System.Drawing.PointF(0.5f, 0.02f); labelArea.AlignmentX = 0.5f; labelArea.AlignmentY = 0.0f; labelArea.Text = "Chart"; FarPoint.Win.Chart.ChartModel model = new FarPoint.Win.Chart.ChartModel(); model.LabelAreas.Add(labelArea); model.PlotAreas.Add(plotArea); FarPoint.Win.Spread.Chart.SpreadChart chart = new FarPoint.Win.Spread.Chart.SpreadChart(); chart.Size = new Size(200, 200); chart.Location = new Point(100, 100); chart.Model = model; fpSpread1.Sheets[0].Charts.Add(chart); |
|
| VB |
Copy Code
|
|---|---|
Dim eh As New FarPoint.Win.Chart.EnhancedSolidLine(System.Drawing.Color.Green, 1, FarPoint.Win.Chart.CompoundType.Double, FarPoint.Win.Chart.DashType.Dash, FarPoint.Win.Chart.CapType.Flat, FarPoint.Win.Chart.JoinType.Round, FarPoint.Win.Chart.ArrowType.Arrow, FarPoint.Win.Chart.ArrowType.OpenArrow, 1, 2) Dim series1 As New FarPoint.Win.Chart.LineSeries() series1.PointMarker = New FarPoint.Win.Chart.BuiltinMarker(FarPoint.Win.Chart.MarkerShape.Circle, 7.0F) series1.PointFill = New FarPoint.Win.Chart.GradientFill(System.Drawing.Color.Coral, System.Drawing.Color.Crimson) series1.PointBorder = New FarPoint.Win.Chart.SolidLine(System.Drawing.Color.Yellow) series1.LineBorder = eh series1.Values.Add(8.0) series1.Values.Add(12.0) series1.Values.Add(14.0) series1.Values.Add(15.0) Dim plotArea As New FarPoint.Win.Chart.YPlotArea() plotArea.Location = New System.Drawing.PointF(0.2F, 0.2F) plotArea.Size = New System.Drawing.SizeF(0.6F, 0.6F) plotArea.Series.Add(series1) Dim labelArea As New FarPoint.Win.Chart.LabelArea() labelArea.Location = New System.Drawing.PointF(0.5F, 0.02F) labelArea.AlignmentX = 0.5F labelArea.AlignmentY = 0.0F labelArea.Text = "Chart" Dim model As New FarPoint.Win.Chart.ChartModel() model.LabelAreas.Add(labelArea) model.PlotAreas.Add(plotArea) Dim chart As New FarPoint.Win.Spread.Chart.SpreadChart() chart.Size = New Size(200, 200) chart.Location = New Point(100, 100) chart.Model = model fpSpread1.Sheets(0).Charts.Add(chart) |
|
Using the Chart Designer
- Right-click on the line in the Line chart.
- Select the Format Series menu.
- Select the Line Border option.
- Select Solid Line.
- Set properties and close the dialog.