Creating a Polar Plot
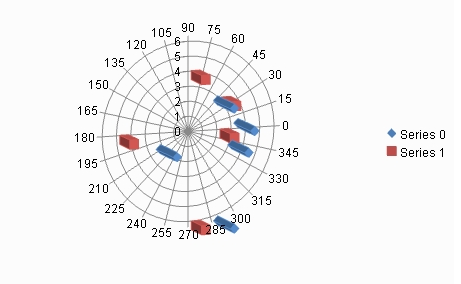
You can create a polar plot chart using code or the designer. The following image shows a Polar Plot type chart.
For details on the API, see the PolarPlotArea class. The following classes are also available when creating Polar plot type charts:
- Point chart (scatter plot)
PolarPointSeries - Line Chart
PolarLineSeries - Area Chart
PolarAreaSeries
In addition, value axes such as ruler lines, memory, and scale labels are set using the following classes.
Using Code
- Create a PolarPointSeries object that represents the data series for the circle chart and add the data.
- Use the PolarPlotArea class to create the plot area.
- Add the series to the plot area.
- Create a label and legend for the chart.
- Create a ChartModel object and add the plot area, label, and legend to the model.
- Create a chart and add the chart model to it.
Example
The following example demonstrates creating a polar point series chart.
| C# |
Copy Code
|
|---|---|
FarPoint.Win.Chart.PolarPointSeries series0 = new FarPoint.Win.Chart.PolarPointSeries(); series0.SeriesName = "Series 0"; series0.XValues.Add(0.0); series0.XValues.Add(45.0); series0.XValues.Add(90.0); series0.XValues.Add(180.0); series0.XValues.Add(270.0); series0.YValues.Add(1.0); series0.YValues.Add(2.0); series0.YValues.Add(3.0); series0.YValues.Add(4.0); series0.YValues.Add(5.0); FarPoint.Win.Chart.PolarPointSeries series1 = new FarPoint.Win.Chart.PolarPointSeries(); series1.SeriesName = "Series 1"; series1.XValues.Add(0.0); series1.XValues.Add(45.0); series1.XValues.Add(90.0); series1.XValues.Add(180.0); series1.XValues.Add(270.0); series1.YValues.Add(2.0); series1.YValues.Add(3.0); series1.YValues.Add(4.0); series1.YValues.Add(5.0); series1.YValues.Add(6.0); FarPoint.Win.Chart.PolarPlotArea plotArea = new FarPoint.Win.Chart.PolarPlotArea(); plotArea.Location = new PointF(0.2f, 0.2f); plotArea.Size = new SizeF(0.6f, 0.6f); plotArea.Series.Add(series0); plotArea.Series.Add(series1); FarPoint.Win.Chart.LabelArea label = new FarPoint.Win.Chart.LabelArea(); label.Text = "Polar Point Chart"; label.Location = new PointF(0.5f, 0.02f); label.AlignmentX = 0.5f; label.AlignmentY = 0.0f; FarPoint.Win.Chart.LegendArea legend = new FarPoint.Win.Chart.LegendArea(); legend.Location = new PointF(0.98f, 0.5f); legend.AlignmentX = 1.0f; legend.AlignmentY = 0.5f; FarPoint.Win.Chart.ChartModel model = new FarPoint.Win.Chart.ChartModel(); model.LabelAreas.Add(label); model.LegendAreas.Add(legend); model.PlotAreas.Add(plotArea); chart2DControl1.Model = model; |
|
| Visual Basic |
Copy Code
|
|---|---|
Dim series0 As New FarPoint.Win.Chart.PolarPointSeries() series0.SeriesName = "Series 0" series0.XValues.Add(0.0) series0.XValues.Add(45.0) series0.XValues.Add(90.0) series0.XValues.Add(180.0) series0.XValues.Add(270.0) series0.YValues.Add(1.0) series0.YValues.Add(2.0) series0.YValues.Add(3.0) series0.YValues.Add(4.0) series0.YValues.Add(5.0) Dim series1 As New FarPoint.Win.Chart.PolarPointSeries() series1.SeriesName = "Series 1" series1.XValues.Add(0.0) series1.XValues.Add(45.0) series1.XValues.Add(90.0) series1.XValues.Add(180.0) series1.XValues.Add(270.0) series1.YValues.Add(2.0) series1.YValues.Add(3.0) series1.YValues.Add(4.0) series1.YValues.Add(5.0) series1.YValues.Add(6.0) Dim plotArea As New FarPoint.Win.Chart.PolarPlotArea() plotArea.Location = New PointF(0.2F, 0.2F) plotArea.Size = New SizeF(0.6F, 0.6F) plotArea.Series.Add(series0) plotArea.Series.Add(series1) Dim label As New FarPoint.Win.Chart.LabelArea() label.Text = "Polar Point Chart" label.Location = New PointF(0.5F, 0.02F) label.AlignmentX = 0.5F label.AlignmentY = 0F Dim legend As New FarPoint.Win.Chart.LegendArea() legend.Location = New PointF(0.98F, 0.5F) legend.AlignmentX = 1.0F legend.AlignmentY = 0.5F Dim model As New FarPoint.Win.Chart.ChartModel() model.LabelAreas.Add(label) model.LegendAreas.Add(legend) model.PlotAreas.Add(plotArea) chart2DControl1.Model = model |
|
Using the Chart designer
- Run Chart Designer.
- Select the target Chart Model from the tree menu on the left.
- Open the Plot Area Collection Editor from PlotAreas in the Other section of the property list on the right.
- Click the drop-down button to the right of the Add button.
- Select and add the PolarPlotArea and set each property as required.
For information on starting Chart Designer, refer to Chart Designer in the SPREAD Designer Guide.