Using the Chart Control
In This Topic
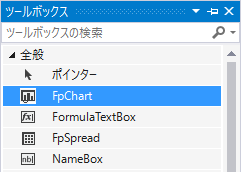
The Chart (FpChart) control appears in the Visual Studio toolbox as the icon in the following image.
You can add chart controls to your form by dragging the FpChart control from the toolbox. Chart controls added to the form can be set using the chart designer or in code as follows:
Chart controls can be saved and loaded into files or streams. See "Save/Load Chart Control" for more information.
Using the Chart Designer
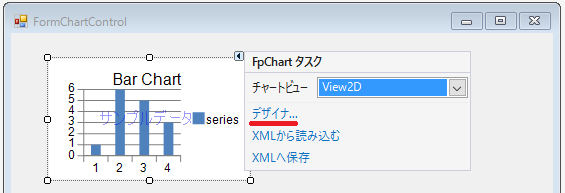
- Drag the FpChart control from the toolbox onto the form.
- You can launch the Chart Designer by selecting Designer from the smart tags of the FpChart control.
For information on creating graphs using the Chart Designer, see Chart Designer.
You can also use code to set the FpChart control without using the chart designer. The code used is similar to the code used to add a chart on a SPREAD sheet.
Using the code
- Create a series object and add data.
- Create plot area using the YPlotArea class.
- Set the position and size of the plot area.
- Add the series object created in step 1 to the plot area.
- Create a label and legend area to display the title.
- Create a chart model and add plot areas, labels, and legend areas.
- Set the Model property of the FpChart control to the chart model created in step 6.
Example
The following example demonstrate how to use the FpChart control to create a bar chart.
| C# |
Copy Code
|
|---|---|
FarPoint.Win.Chart.BarSeries series = new FarPoint.Win.Chart.BarSeries(); series.SeriesName = "Series 0"; series.Values.Add(2.0); series.Values.Add(4.0); series.Values.Add(3.0); series.Values.Add(5.0); FarPoint.Win.Chart.YPlotArea plotArea = new FarPoint.Win.Chart.YPlotArea(); plotArea.Location = new System.Drawing.PointF(0.2f, 0.2f); plotArea.Size = new System.Drawing.SizeF(0.6f, 0.6f); plotArea.Series.Add(series); FarPoint.Win.Chart.LabelArea label = new FarPoint.Win.Chart.LabelArea(); label.Text = "Bar Chart"; label.Location = new System.Drawing.PointF(0.5f, 0.02f); label.AlignmentX = 0.5f; label.AlignmentY = 0.0f; FarPoint.Win.Chart.LegendArea legend = new FarPoint.Win.Chart.LegendArea(); legend.Location = new System.Drawing.PointF(0.98f, 0.5f); legend.AlignmentX = 1.0f; legend.AlignmentY = 0.5f; FarPoint.Win.Chart.ChartModel model = new FarPoint.Win.Chart.ChartModel(); model.LabelAreas.Add(label); model.LegendAreas.Add(legend); model.PlotAreas.Add(plotArea); fpChart1.Model = model; |
|
| Visual Basic |
Copy Code
|
|---|---|
Dim series As New FarPoint.Win.Chart.BarSeries() series.SeriesName = "Series 0" series.Values.Add(2.0) series.Values.Add(4.0) series.Values.Add(3.0) series.Values.Add(5.0) Dim plotArea As New FarPoint.Win.Chart.YPlotArea() plotArea.Location = New System.Drawing.PointF(0.2F, 0.2F) plotArea.Size = New System.Drawing.SizeF(0.6F, 0.6F) plotArea.Series.Add(series) Dim label As New FarPoint.Win.Chart.LabelArea() label.Text = "Bar Chart" label.Location = New System.Drawing.PointF(0.5F, 0.02F) label.AlignmentX = 0.5F label.AlignmentY = 0.0F Dim legend As New FarPoint.Win.Chart.LegendArea() legend.Location = New System.Drawing.PointF(0.98F, 0.5F) legend.AlignmentX = 1.0F legend.AlignmentY = 0.5F Dim model As New FarPoint.Win.Chart.ChartModel() model.LabelAreas.Add(label) model.LegendAreas.Add(legend) model.PlotAreas.Add(plotArea) FpChart1.Model = model |
|