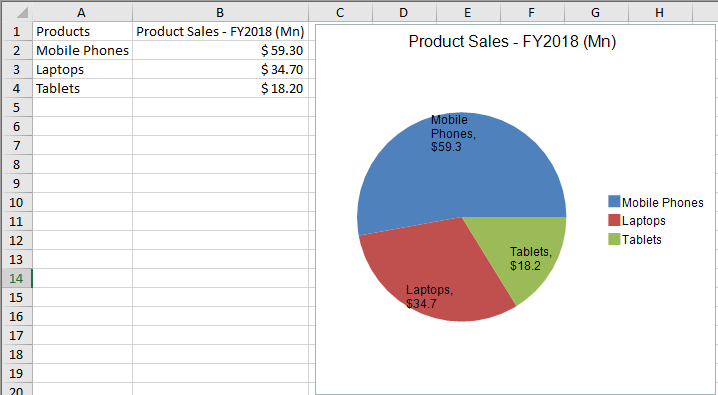
You can create a pie plot chart using code or the designer. The following image shows a Pie Plot type chart for sales of electronic products.
For details on the API, see the PiePlotArea class. Also, to create a pie chart, use the PieSeries class that represents the data series of the circle chart.
- To set the pie detachments, set the PieDetachments property of the PieSeries class.
- To create a donut chart, set the size of the hole in the center of the circle chart with the HoleSize property of the PiePlotArea class.
Using code
- Create a PieSeries object that represents the data series for the circle chart and add the data.
- Create a PiePlotArea object that represents the plot area and set its position and size.
- Add a data series to the plot area.
- Create labels and legend areas.
- Create a ChartModel object and add plot areas, labels, and legend areas.
- Assign a chart model to the chart.
Example
The following example creates a pie chart to display the annual sales of electronic products (Mobile Phones, Laptops, Tablets) in a store.
| C# |
Copy Code
|
|---|---|
// Creating Pie Chart fpSpread1.Sheets[0].Cells[0, 0].Text = "Products"; fpSpread1.Sheets[0].Cells[1, 0].Text = "Mobile Phones"; fpSpread1.Sheets[0].Cells[2, 0].Text = "Laptops"; fpSpread1.Sheets[0].Cells[3, 0].Text = "Tablets"; fpSpread1.Sheets[0].Cells[0, 1].Text = "Product Sales - FY2018 (Mn)"; fpSpread1.Sheets[0].Cells[1, 1].Value = 59.3; fpSpread1.Sheets[0].Cells[2, 1].Value = 34.7; fpSpread1.Sheets[0].Cells[3, 1].Value = 18.2; CurrencyCellType currencycell = new CurrencyCellType(); currencycell.DecimalPlaces = 2; currencycell.ShowCurrencySymbol = true; currencycell.CurrencySymbol = "$"; fpSpread1.Sheets[0].Cells[1, 1, 3, 1].CellType = currencycell; FarPoint.Win.Spread.Chart.SpreadChart chart = fpSpread1.Sheets[0].AddChart(0, 0, typeof(FarPoint.Win.Chart.PieSeries), 400, 370, 240, 30); FarPoint.Win.Chart.PieSeries series = (FarPoint.Win.Chart.PieSeries)chart.Model.PlotAreas[0].Series[0]; series.LabelVisible = true; series.LabelContainsCategoryName = true; series.LabelContainsValue = true; |
|
| Visual Basic |
Copy Code
|
|---|---|
// Creating Pie Chart fpSpread1.Sheets(0).Cells(0, 0).Text = "Products" fpSpread1.Sheets(0).Cells(1, 0).Text = "Mobile Phones" fpSpread1.Sheets(0).Cells(2, 0).Text = "Laptops" fpSpread1.Sheets(0).Cells(3, 0).Text = "Tablets" fpSpread1.Sheets(0).Cells(0, 1).Text = "Product Sales - FY2018 (Mn)" fpSpread1.Sheets(0).Cells(1, 1).Value = 59.3 fpSpread1.Sheets(0).Cells(2, 1).Value = 34.7 fpSpread1.Sheets(0).Cells(3, 1).Value = 18.2 Dim currencycell As CurrencyCellType = New CurrencyCellType() currencycell.DecimalPlaces = 2 currencycell.ShowCurrencySymbol = True currencycell.CurrencySymbol = "$" fpSpread1.Sheets(0).Cells(1, 1, 3, 1).CellType = currencycell Dim chart As FarPoint.Win.Spread.Chart.SpreadChart = fpSpread1.Sheets(0).AddChart(0, 0, GetType(FarPoint.Win.Chart.PieSeries), 400, 370, 240, 30) Dim series As FarPoint.Win.Chart.PieSeries = CType(chart.Model.PlotAreas(0).Series(0), FarPoint.Win.Chart.PieSeries) series.LabelVisible = True series.LabelContainsCategoryName = True series.LabelContainsValue = True |
|
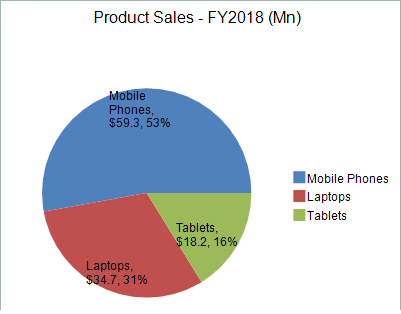
You can also add percentage labels in the pie chart by using LabelContainsPercentage property of the PieSeries class. It accepts boolean value and is false by default.
| C# |
Copy Code
|
|---|---|
// Enable Percentage label in pie chart series.LabelContainsPercentage = true; |
|
| Visual Basic |
Copy Code
|
|---|---|
// Enable Percentage label in pie chart series.LabelContainsPercentage = true; |
|
Using the Chart designer
Pie charts can be created in the Chart Designer using the following steps -
- Run Chart Designer.
- Select the target Chart Model from the tree menu on the left.
- Open the Plot Area Collection Editor from PlotAreas in the Other section of the property list on the right.
- Click the drop-down button to the right of the Add button.
- Select and add the PiePlotArea and set each property as required.
You can also enable percentage labels in the Chart Designer by selecting the Pie Series target from the tree menu on the left and enable the LabelContainsPercentage option to True on the property list.
