符号。数据点的自定义
在上一篇C1Chart for WPF初级教程-颜色和大小。数据点的自定义(一)中,我们介绍如何自定义数据点的颜色和大小,
本章,我们就接着这个话题进行讨论,如何对数据点的形状来进行自定义。
自定义符号
现在我们就来介绍如何在默认的符号样式展示自定义的图像,图表的类型是LineSymbols图表。</>
在DataSeries中使用自定义图像
我们需要使用自定义图像来替换默认的书店的符号样式,我首先需要创建custom style。
代码如下:
<Window.Resources>
    <Style x:Key="happy" TargetType="{x:Type c1:PlotElement}">
        <Setter Property="Stroke" Value="Transparent"/>
        <Setter Property="Fill">
            <Setter.Value>
                <ImageBrush>
                    <ImageBrush.ImageSource>
                        <BitmapImage UriSource="pack://application:,,,/Images/happy.jpg"/>
                    </ImageBrush.ImageSource>
                </ImageBrush>
            </Setter.Value>
        </Setter>
    </Style>
</Window.Resources>
现在,我们设置这个样式给一个特定的DataSeries,通过XAML或代码实现。
通过XAML:
<c1:DataSeries Label="Growth" SymbolStyle="{StaticResource happy}" SymbolMarker="Box" SymbolSize="30,30" RenderMode="Default" Values="20 45 19 24 25 5 15 30 12 40" />通过代码:
使用PlotElementLoaded事件来实现XAML相同的功能。
private void DataSeries_PlotElementLoaded(object sender, EventArgs e)
{
    PlotElement pe = (PlotElement)sender;

    if (!(pe is Lines)) // skip lines
    {
        DataPoint dp = pe.DataPoint;
        pe.Fill = new ImageBrush(new BitmapImage(new Uri("pack://application:,,,/Images/happy.jpg")));
    }
}
对DataSeries使用不同的自定义图像
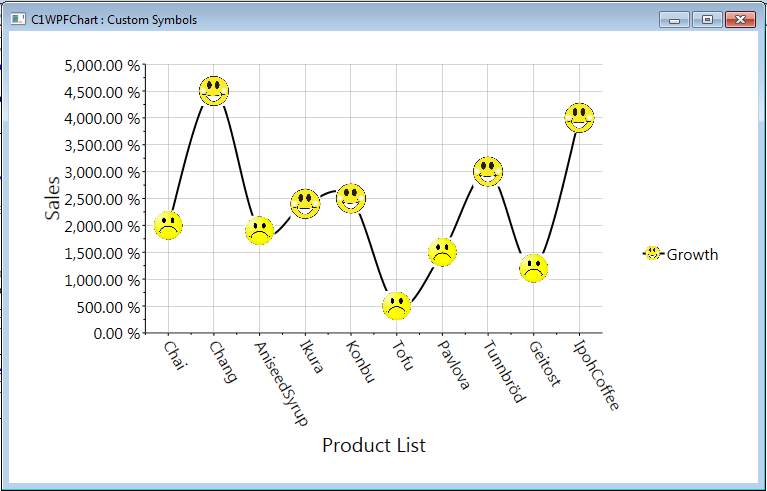
许多时候,我们希望对于一个序列series基于某种条件展示不同的符号样式。举例来说,假设有一系列的值,我们想要基于不同值展示不同的符号样式。当值大于20和小于20的时候,符号是不一样的。
为了实现这个需求,我们在XAML创建style,并且在PlotElementLoaded事件里进行处理。
如下所示:
private void DataSeries_PlotElementLoaded(object sender, EventArgs e)
{
    PlotElement pe = (PlotElement)sender;

    if (!(pe is Lines)) // skip lines
    {
        DataPoint dp = pe.DataPoint;
        pe.Stroke = Brushes.Transparent;
        if (dp.Value <= 20)
        {
            pe.Fill = new ImageBrush(new BitmapImage(new Uri("pack://application:,,,/Images/sad.jpg")));
        }
        else if (dp.Value > 20)
        {
            pe.Fill = new ImageBrush(new BitmapImage(new Uri("pack://application:,,,/Images/happy.jpg")));
        }
    }
}
最终结果如下所示:
本文的示例请参考如下。
C#示例代码:Wpf_Chart_CustomSymbol_CS.zip (32.75 kb)
VB示例代码: Wpf_Chart_CustomSymbols_VB.zip (35.60 kb)
Chart的在线英文产品文档地址:
http://helpcentral.componentone.com/nethelp/c1wpfchart/#!Documents/componentonechartforwpf.htm
如果你对C1Chart感兴趣,请到我们的官网下载最新版本:/developer/componentone-winform/controls/chart
如果你有疑问,可以到GCDN论坛获得技术支持:http://gcdn.grapecity.com.cn/showforum-68.html
《C1Chart for WPF初级教程》系列文章:
ComponentOne Enterprise | 下载试用
ComponentOne 是一套专注于企业 .NET开发、支持 .NET Core 平台,并完美集成于 Visual Studio 的第三方控件集,包含 300 多种 .NET开发控件,提供表格数据管理、数据可视化、报表和文档、日程安排、输入和编辑、导航和布局、系统提升工具等七大功能,被誉为“.NET开发的‘瑞士军刀’”。
ComponentOne 为您提供专业的产品咨询服务,并由技术支持工程师为您1对1解答。>> 发帖提问