数据可视化大屏已成为企业数字化转型的重要标志。不论是私营企业、国有企业、政府机构、学校还是公益组织,通过数据可视化大屏展示主要成果,可以以直观的方式呈现数据。在数据可视化大屏开发中,ECharts作为业界的标杆,提供了丰富的图表类型、视觉效果和动画效果,成为无可或缺的利器。
ECharts开源社区的源码下载
ECharts尽管功能强大,但许多开发者发现其标准示例效果并不那么令人惊艳。在ECharts加入Apache之前,开发者们一直通过Make A Pie网站分享各种酷炫的图表效果和源码。然而,遗憾的是,该网站已永久关闭。
不过,为了帮助大家找到更多图表效果和源码,我为大家找到了一些替代网站。这些网站不仅提供以前的代码,还有许多社区贡献者持续发布的新作品。通过这些平台,开发者们可以发现更多炫酷的图表效果,并借鉴和应用于自己的项目中。
如果采用纯前端框架(如Vue、React、Ant Design)+ ECharts的纯代码开发方式,开发者们可以从上述社区中找到所需的图表效果,并通过复用代码实现快速开发。比如:
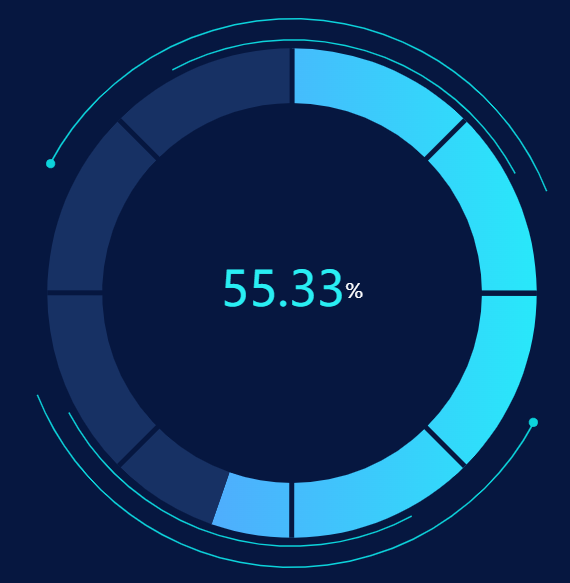
动画装饰仪表板
https://www.makeapie.cn/echarts_content/xFkzKG-bpl.html
let angle = 0;//角度,用来做简单的动画效果的
let value = 55.33;
option = {
backgroundColor:"#061740",
title: {
        text: '{a|'+ value +'}{c|%}',
        x: 'center',
        y: 'center',
        textStyle: {
            rich:{
                a: {
                    fontSize: 48,
                    color: '#29EEF3'
                },

                c: {
                    fontSize: 20,
                    color: '#ffffff',
                    // padding: [5,0]
                }
            }
        }
    },
    legend: {
        type: "plain",
        orient: "vertical",
        right: 0,
        top: "10%",
        align: "auto",
        data: [{
            name: '涨价后没吃过',
            icon: "circle"
        }, {
            name: '天天吃',
            icon: "circle"
        }, {
            name: '三五天吃一次',
            icon: "circle"
        }, {
            name: '半个月吃一次',
            icon: "circle"
        }],
        textStyle: {
            color: "white",
            fontSize: 16,
            padding: [10, 1, 10, 0]
        },
        selectedMode:false
    },
    series: [ {
            name: "ring5",
            type: 'custom',
            coordinateSystem: "none",
            renderItem: function(params, api) {
                return {
                    type: 'arc',
                    shape: {
                        cx: api.getWidth() / 2,
                        cy: api.getHeight() / 2,
                        r: Math.min(api.getWidth(), api.getHeight()) / 2 * 0.6,
                        startAngle: (0+angle) * Math.PI / 180,
                        endAngle: (90+angle) * Math.PI / 180
                    },
                    style: {
                        stroke: "#0CD3DB",
                        fill: "transparent",
                        lineWidth: 1.5
                    },
                    silent: true
                };
            },
            data: [0]
        }, {
            name: "ring5",
            type: 'custom',
            coordinateSystem: "none",
            renderItem: function(params, api) {
                return {
                    type: 'arc',
                    shape: {
                        cx: api.getWidth() / 2,
                        cy: api.getHeight() / 2,
                        r: Math.min(api.getWidth(), api.getHeight()) / 2 * 0.6,
                        startAngle: (180+angle) * Math.PI / 180,
                        endAngle: (270+angle) * Math.PI / 180
                    },
                    style: {
                        stroke: "#0CD3DB",
                        fill: "transparent",
                        lineWidth: 1.5
                    },
                    silent: true
                };
            },
            data: [0]
        }, {
            name: "ring5",
            type: 'custom',
            coordinateSystem: "none",
            renderItem: function(params, api) {
                return {
                    type: 'arc',
                    shape: {
                        cx: api.getWidth() / 2,
                        cy: api.getHeight() / 2,
                        r: Math.min(api.getWidth(), api.getHeight()) / 2 * 0.65,
                        startAngle: (270+-angle) * Math.PI / 180,
                        endAngle: (40+-angle) * Math.PI / 180
                    },
                    style: {
                        stroke: "#0CD3DB",
                        fill: "transparent",
                        lineWidth: 1.5
                    },
                    silent: true
                };
            },
            data: [0]
        }, {
            name: "ring5",
            type: 'custom',
            coordinateSystem: "none",
            renderItem: function(params, api) {
                return {
                    type: 'arc',
                    shape: {
                        cx: api.getWidth() / 2,
                        cy: api.getHeight() / 2,
                        r: Math.min(api.getWidth(), api.getHeight()) / 2 * 0.65,
                        startAngle: (90+-angle) * Math.PI / 180,
                        endAngle: (220+-angle) * Math.PI / 180
                    },
                    style: {
                        stroke: "#0CD3DB",
                        fill: "transparent",
                        lineWidth: 1.5
                    },
                    silent: true
                };
            },
            data: [0]
        }, {
            name: "ring5",
            type: 'custom',
            coordinateSystem: "none",
            renderItem: function(params, api) {
                let x0 = api.getWidth() / 2;
                let y0 = api.getHeight() / 2;
                let r = Math.min(api.getWidth(), api.getHeight()) / 2 * 0.65;
                let point = getCirlPoint(x0, y0, r, (90+-angle))
                return {
                    type: 'circle',
                    shape: {
                        cx: point.x,
                        cy: point.y,
                        r: 4
                    },
                    style: {
                        stroke: "#0CD3DB",//粉
                        fill: "#0CD3DB"
                    },
                    silent: true
                };
            },
            data: [0]
        }, {
            name: "ring5",  //绿点
            type: 'custom',
            coordinateSystem: "none",
            renderItem: function(params, api) {
                let x0 = api.getWidth() / 2;
                let y0 = api.getHeight() / 2;
                let r = Math.min(api.getWidth(), api.getHeight()) / 2 * 0.65;
                let point = getCirlPoint(x0, y0, r, (270+-angle))
                return {
                    type: 'circle',
                    shape: {
                        cx: point.x,
                        cy: point.y,
                        r: 4
                    },
                    style: {
                        stroke: "#0CD3DB",      //绿
                        fill: "#0CD3DB"
                    },
                    silent: true
                };
            },
            data: [0]
        }, {
            name: '吃肉频率',
            type: 'pie',
            radius: ['58%', '45%'],
            silent: true,
            clockwise: true,
            startAngle: 90,
            z: 0,
            zlevel: 0,
            label: {
                normal: {
                    position: "center",

                }
            },
            data: [{
                    value: value,
                    name: "",
                    itemStyle: {
                        normal: {
                            color: { // 完成的圆环的颜色
                                colorStops: [{
                                    offset: 0,
                                    color: '#4FADFD' // 0% 处的颜色
                                }, {
                                    offset: 1,
                                    color: '#28E8FA' // 100% 处的颜色
                                }]
                            },
                        }
                    }
                },
                {
                    value: 100-value,
                    name: "",
                    label: {
                        normal: {
                            show: false
                        }
                    },
                    itemStyle: {
                        normal: {
                            color: "#173164"
                        }
                    }
                }
            ]
        },

        {
            name: "",
            type: "gauge",
            radius: "58%",
            center: ['50%', '50%'],
            startAngle: 0,
            endAngle: 359.9,
            splitNumber: 8,
            hoverAnimation: true,
            axisTick: {
                show: false
            },
            splitLine: {
                length: 60,
                lineStyle: {
                    width: 5,
                    color: "#061740"
                }
            },
            axisLabel: {
                show: false
            },
            pointer: {
                show: false
            },
            axisLine: {
                lineStyle: {
                    opacity: 0
                }
            },
            detail: {
                show: false
            },
            data: [{
                value: 0,
                name: ""
            }]
        },

    ]
};

//获取圆上面某点的坐标(x0,y0表示坐标,r半径,angle角度)
function getCirlPoint(x0, y0, r, angle) {
    let x1 = x0 + r * Math.cos(angle * Math.PI / 180)
    let y1 = y0 + r * Math.sin(angle * Math.PI / 180)
    return {
        x: x1,
        y: y1
    }
}

function draw(){
    angle = angle+3
    myChart.setOption(option, true)
   //window.requestAnimationFrame(draw);
}

setInterval(function() {
    //用setInterval做动画感觉有问题
    draw()
}, 100);
新型玫瑰图
https://www.makeapie.cn/echarts_content/xHJ9to6zOx.html

function data(){
    var d = [];
    for (var i = 0; i < 24; i++) {
        d.push({name:i+'~'+(i+1),value:Math.random()*100});
    }
    return d;
}

option = {
    title : {
        text: '某站点用户访问来源',
        subtext: '纯属虚构',
        x:'center'
    },
    tooltip: {
        trigger: 'item',
        position: ['48.5%', '49.2%'],
        backgroundColor: 'rgba(50,50,50,0)',
        textStyle : {
            color: 'yellow',
            fontWeight: 'bold'
        },
        formatter: "{d}%"
    },
    series : [
        {
            name: '上网时间',
            type: 'pie',
            radius : ['5%', '70%'],
            roseType: 'area',
            color:['#3fa7dc'],
            data:data(),
            labelLine: {
                normal: {
                    show: false
                }
            },
            label: {
                normal: {
                    show: false
                }
            },
            itemStyle: {
                normal: {
                    shadowBlur: 10,
                    shadowOffsetX: 0,
                    shadowColor: 'rgba(0, 0, 0, 0.5)'
                },
                emphasis: {
                    shadowBlur: 10,
                    shadowOffsetX: 0,
                    shadowColor: 'rgba(0, 0, 0, 0.5)'
                }
            }
        },
        {
            name: '',
            type: 'gauge',
            min: 0,
            max: 24,
            startAngle: 90,
            endAngle: 449.9,
            radius: '82%',
            splitNumber: 24,
            clockwise: false,
            animation: false,
            detail: {
                formatter: '{value}',
                textStyle: {
                    color: '#63869e'
                }
            },
            detail:{
                show: false
            },
            axisTick: {
                show: false
            },
            axisLine: {
                lineStyle: {
                    color: [
                        [0.25, '#63869e'],
                        [0.75, '#ffffff'],
                        [1, '#63869e']
                    ],
                    width: '40%',
                    shadowColor: '#0d4b81', //默认透明
                    shadowBlur: 40,
                    opacity: 1
                }
            },
            splitLine: {
                length: 5,
                lineStyle: {
                    color: '#ffffff',
                    width: 2
                }
            },
            axisLabel: {
                formatter: function(v){
                    return v?v:'';
                },
                textStyle: {
                    color: "red",
                    fontWeight: 700
                }
            },
            itemStyle: {
                normal: {
                    color: 'green',
                    width: 2
                }
            }
        },
        {
            name: '',
            type: 'gauge',
            min: 0,
            max: 24,
            startAngle: 90,
            endAngle: 449.9,
            radius: '72%',
            splitNumber: 24,
            clockwise: false,
            animation: false,
            detail: {
                formatter: '{value}',
                textStyle: {
                    color: '#63869e'
                }
            },
            detail:{
                show: false
            },
            axisTick: {
                show: false
            },
            axisLine: {
                lineStyle: {
                    color: [
                        [1, '#E8E8E8']
                    ],
                    width: '10%',
                    opacity:0.8
                }
            },
            splitLine: {
                show:true,
                length: '92%',
                lineStyle: {
                    color: 'grey',
                    width: '1'
                }
            },
            axisLabel: {
                show:false,
                formatter: function(v){
                    return v?v:'';
                },
                textStyle: {
                    color: "#fb5310",
                    fontWeight: 700
                }
            },
            itemStyle: {
                normal: {
                    color: 'green',
                    width: 2,
                    borderWidth: 3,
                }
            }
        }
    ]
};
确实,使用纯代码开发数据可视化大屏、做商业化智能分析,虽然可以复用ECharts的图表效果,但是要实现图表数据的联动分析、数据钻取等功能,还需要进行自主的代码开发。如果开发者们希望打造一个具有数据交互功能的数据可视化大屏,仅仅依靠ECharts可能无法满足预期,还需要结合前后端进行更多的代码开发。
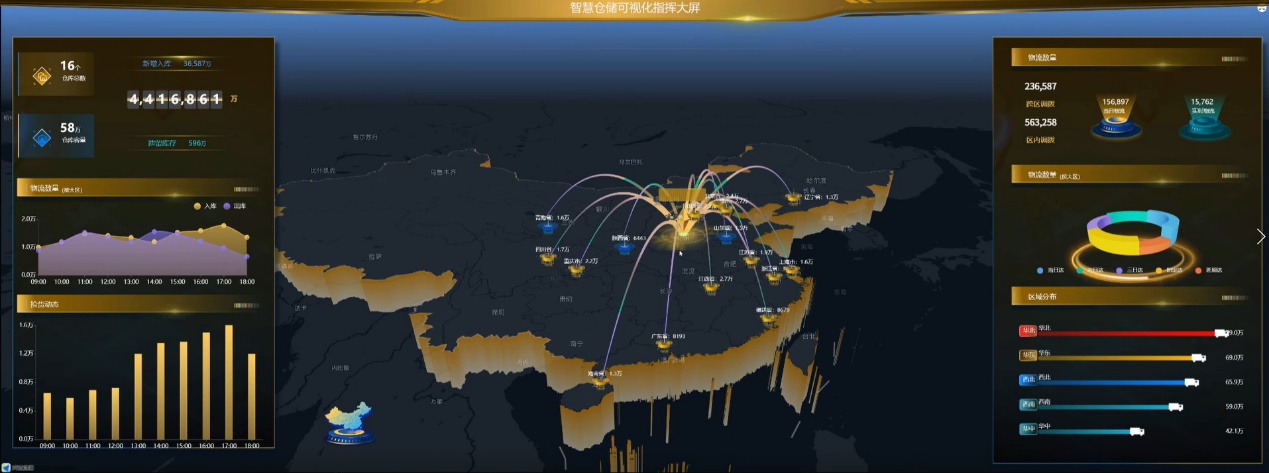
在Wyn中使用ECharts设计数据可视化大屏
Wyn商业智能软件可以通过拖拉拽的方式快速设计酷炫的数据可视化大屏,如果你已经基于ECharts开发了个性化的图表效果,可以直接复用到Wyn大屏设计器中,同时,可以直接复用Wyn内置的数据交互分析能力,创建可视化类型更丰富、支持用户交互分析、多屏自适应的数据可视化大屏。
首先,您可以直接从Wyn官方的应用市场免费下载所需的ECharts图表类型。这个市场上提供了超过100种图表类型的选择,Wyn团队真的很贴心。您可以通过简单的下载操作,轻松获取所需的图表类型,为您的数据可视化大屏增添更多元、更丰富的视觉效果。https://marketplace.grapecity.com.cn/ProductList?productType=wyn&moduleType=wyn-plugin&sortBy=new
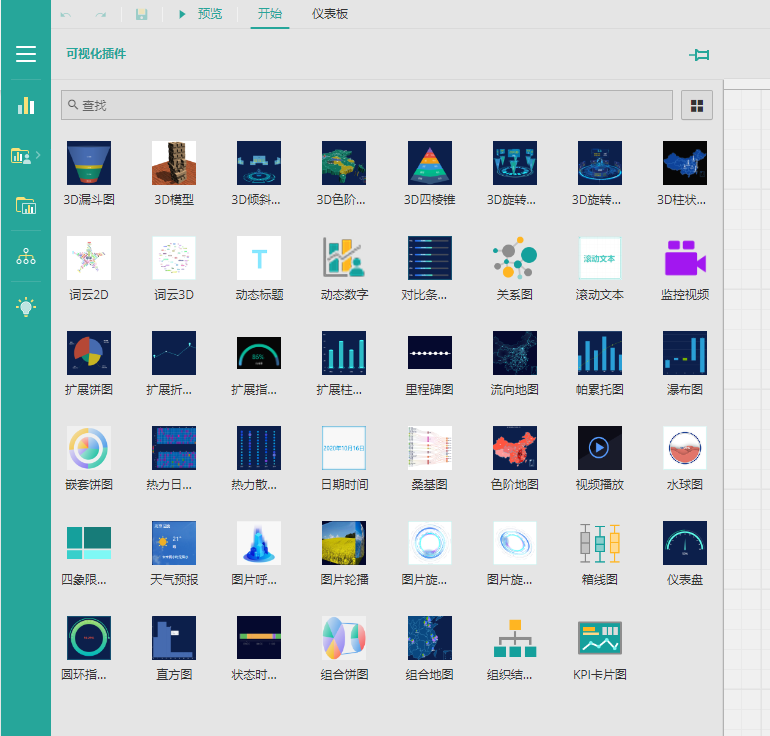
如果您发现Wyn官方应用市场提供的ECharts类型仍无法满足您的需求,别担心,您还可以利用Wyn提供的可视化插件和扩展API进行定制开发。
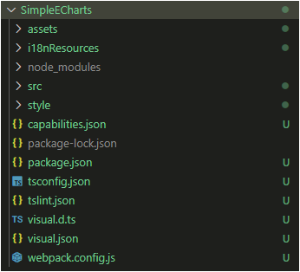
以下是将ECharts集成到Wyn仪表板设计器的参考示例代码:
https://www.grapecity.com.cn/solutions/wyn/help/docs/cv/demo
Wyn的应用市场提供了丰富的可视化大屏效果供用户选择,您可以根据自己的需求和喜好进行下载和应用。
下载地址:
https://marketplace.grapecity.com.cn/ProductList?productType=wyn&moduleType=wyn-plugin&sortBy=new


Wyn 商业智能软件| 下载试用
Wyn 是西安葡萄城自主研发的嵌入式商业智能软件,能帮助企业用户发现更多的数据潜在价值,为管理者制定决策提供数据支撑。Wyn 具备完整的嵌入式分析能力,能够与其他软件深度集成,也可独立部署使用,快速提升数据展示和分析能力。
Wyn 支持公有云、私有云和本地部署等多种部署方式,并能在Java、.net、PHP等开发平台中使用。您可以将其与ERP、CRM、OA等业务系统,以及钉钉、企业微信等APP进行深度集成,持续交付BI和报表功能,助力您的客户发现数据的价值。
了解更多关于 Wyn 嵌入式商业智能软件的内容,请点击此处访问官网,立即下载体验。


.nwLOc.png)


.Ft4yd.png)