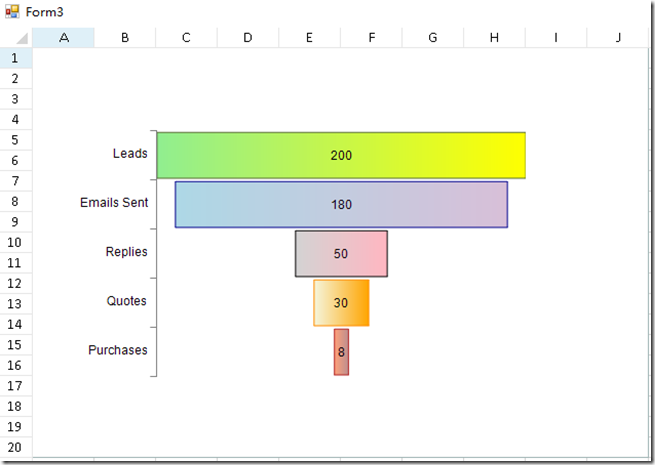
漏斗图是一个非常实用的工具,在流程管理中经常被使用,它用来衡量网站中业务流程表现,并适用于电商等各个行业,漏斗图可以直观地看出业务流程中的问题所在,从而加以完善。
例如,由于渠道图表显示销售流程多个阶段的数值,因此可以使用它们来了解有多少销售线索转换为购买。
在Spread Windows Forms中,通过以下操作可以创建一个漏斗图的模型。
1.初始化series并添加数据
FarPoint.Win.Chart.FunnelSeries funnel = new FarPoint.Win.Chart.FunnelSeries();funnel.SeriesName = "Series0";funnel.Values.Add(200);funnel.Values.Add(180);funnel.Values.Add(50);funnel.Values.Add(30);funnel.Values.Add(8);funnel.CategoryNames.Add("Leads");funnel.CategoryNames.Add("Emails Sent");funnel.CategoryNames.Add("Replies");funnel.CategoryNames.Add("Quotes");funnel.CategoryNames.Add("Purchases");funnel.BarFills.AddRange(new FarPoint.Win.Chart.GradientFill[] { new FarPoint.Win.Chart.GradientFill(Color.LightGreen, Color.Yellow), new FarPoint.Win.Chart.GradientFill(Color.LightBlue, Color.Thistle), new FarPoint.Win.Chart.GradientFill(Color.LightGray, Color.LightPink), new FarPoint.Win.Chart.GradientFill(Color.Beige, Color.Orange), new FarPoint.Win.Chart.GradientFill(Color.LightSalmon, Color.RosyBrown) });funnel.BarBorders.AddRange(new FarPoint.Win.Chart.Line[] { new FarPoint.Win.Chart.SolidLine(Color.DarkOliveGreen), new FarPoint.Win.Chart.SolidLine(Color.DarkBlue), new FarPoint.Win.Chart.SolidLine(Color.Black), new FarPoint.Win.Chart.SolidLine(Color.DarkOrange), new FarPoint.Win.Chart.SolidLine(Color.Firebrick) });
2.初始化PlotArea,并添加series
FarPoint.Win.Chart.YPlotArea plotArea = new FarPoint.Win.Chart.YPlotArea();plotArea.Location = new PointF(0.2f, 0.2f);plotArea.Size = new SizeF(0.6f, 0.6f);plotArea.XAxis.Reverse = true;plotArea.Vertical = false;plotArea.Series.Add(funnel);
此处需要注意,由于漏斗图的x轴与y轴相对于一般报表来说是垂直显示的所以需要设置plotArea.Vertical = false;再者因为X轴数据是倒置的(从上到下)所以需设置plotArea.XAxis.Reverse = true;这两个是与一般报表设置不同的地方,需要���意。
3.创建chart model模型并添加Plotarea
FarPoint.Win.Chart.ChartModel model = new FarPoint.Win.Chart.ChartModel();model.PlotAreas.Add(plotArea);
4.初始化chart对象,并设置对象中的model属性
FarPoint.Win.Spread.Chart.SpreadChart chart = new FarPoint.Win.Spread.Chart.SpreadChart();chart.Model = model;chart.Left = 0;chart.Top = 150;chart.Size = new Size(600, 400);
5.添加该chart
fpSpread1.ActiveSheet.Charts.Add(chart);
以上就是全部的步骤,让我们来看看效果如何:
以上就是Spread Windows Forms实现瀑布图的主要内容。
相关源码下载可以点击以下网址进行下载
http://gcdn.grapecity.com.cn/forum.php?mod=viewthread&tid=38569&extra=page%3D1
有兴趣想要下载本产品的可以在以下网址进行下载试用:
Spread Windows Forms还可以实现很多精彩的功能,您可以访问以下站点进行详细了解:


