C1FlexGrid 是一款功能丰富体积轻巧的表格控件。它借鉴了微软 Excel 的操作风格,丰富的数据操作功能、快捷键、选择模式剪切板支持等。并且具有灵活的外观设置和高效的性能。
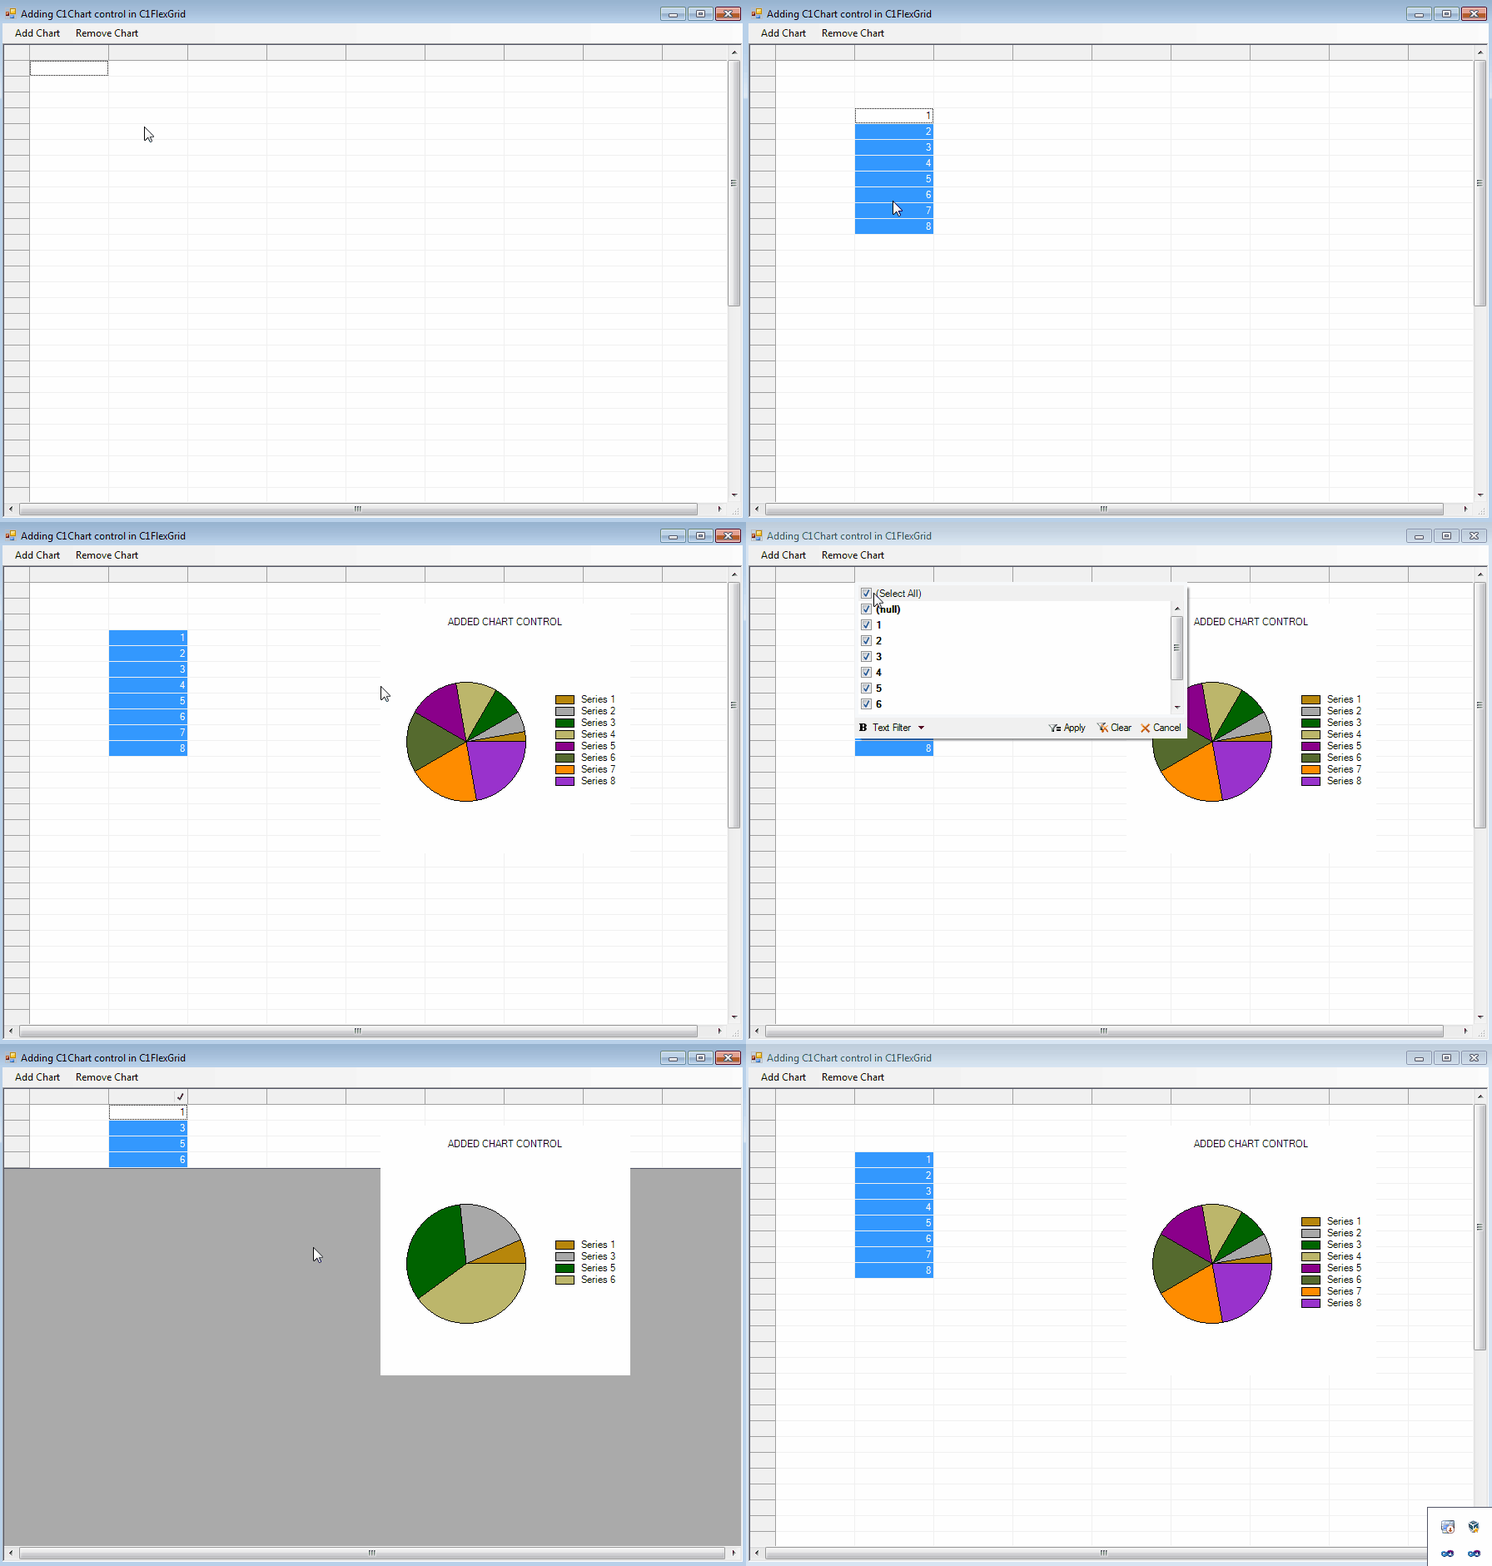
本篇文章阐述如何添加 Chart 到C1FlexGrid-Excel 的另一个强大功能。在本文中,我们将添加 C1Chart 控件,怎样设置 C1Chart 的位置。
添加 Chart 到图表中 如 Excel 中,当用户选择数据,添加图表到表单中,Chart 将直观的显示数据的走势。在 C1FlexGrid 中,我们可以通过以下代码实现:
private void addChartToolStripMenuItem_Click(object sender, EventArgs e)
{
  if (c1FlexGrid1.Clip != "")
  {
     data = c1FlexGrid1.Clip;   // capture the selected data in the grid
     string[] values = data.Split('\r');
     if (ischart == true)         // if the chart already exists in the grid then clear the series collection
     {
       chart.ChartGroups[0].ChartData.SeriesList.Clear();
       C1.Win.C1Chart.ChartDataSeries cds;        // Add new data
       for (int i = 0; i < values.Length; i++)
       {
          if (values[ i ] != "")
          {
             cds = new C1.Win.C1Chart.ChartDataSeries();
             cds = chart.ChartGroups[0].ChartData.SeriesList.AddNewSeries();
             cds.PointData.Length = 1;
             cds.Label = "Series " + values[ i ].ToString();
             cds.Y[0] = Convert.ToInt16(values[ i ]);
          }
        }
   }
   else   // if it doesn't, then add a new chart
   {
     chart = new C1.Win.C1Chart.C1Chart();
     c1FlexGrid1.Controls.Add(chart);
     chart.Location = new Point(200, 100);
     chart.Size = new Size(300,300);
     chart.Legend.Visible = true;
     chart.Header.Visible = true;
     chart.Header.Text = "ADDED CHART CONTROL";
     chart.MouseDown += new MouseEventHandler(chart_MouseDown);
     chart.MouseCaptureChanged += new EventHandler(chart_MouseCaptureChanged);
     chart.ChartGroups[0].ChartType = C1.Win.C1Chart.Chart2DTypeEnum.Pie;
     chart.ChartGroups[0].ChartData.SeriesList.Clear();
     C1.Win.C1Chart.ChartDataSeries cds;
     for (int i = 0; i < values.Length; i++)       // Add Data
     {
        if (values[ i ] != "")
        {
          cds = new C1.Win.C1Chart.ChartDataSeries();
          cds = chart.ChartGroups[0].ChartData.SeriesList.AddNewSeries();
          cds.PointData.Length = 1;
          cds.Label = "Series " + values[ i ].ToString();
          cds.Y[0] = Convert.ToInt16(values[ i ]);
        }
      }
    }

   ischart = true;                                // now the chart is there on the grid
  }
}
设置 Chart 的位置:
添加 Chart 后,Chart覆盖于 C1FlexGrid 上,可以通过以下代码设置 Chart 位置。
void chart_MouseDown(object sender, MouseEventArgs e)
{
  chartPoint = e.Location;   // Capture the Chart Control for moving
}

void chart_MouseCaptureChanged(object sender, EventArgs e)
{
  Point tmpPoint = c1FlexGrid1.HitTest().Point;
  // drop it in the user specified place in the grid
  chart.Location = new Point(tmpPoint.X - chartPoint.X, tmpPoint.Y - chartPoint.Y);
}
效果图:
下载示例:Download CS Sample
